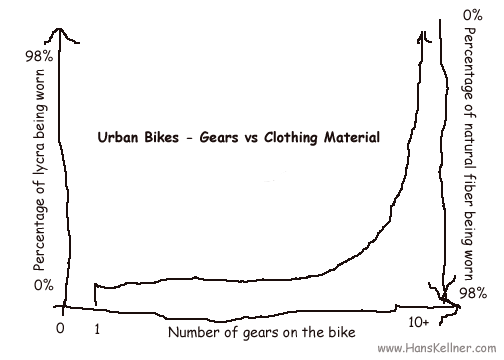
A chart based on very scientific observations in and around the urban San Francisco bay area biking mecca.

A mighty fine website!
A chart based on very scientific observations in and around the urban San Francisco bay area biking mecca.
Oops, my bad. I didn’t read the graph label close enough. Sorry
Okay, I’ve got better things to do at work than comment on your website content all day, but you’ve got a problem I think, with your second vertical axis on this graph. (again with the vertical/horizontal). While I’m assuming you meant to illustrate an inverse relationship between gear ratio options and synthetic fibers, what you’re showing is that a single speeder or fixie has 0% lycra, whereas the 10 gear triple rider has 0% lycra. .
Please correct so that it corresponds with my own observations .
Leave a Reply